But instead of acting on these findings to iterate on options for the road diet, Caltrans District 4 has apparently decided to prioritize seconds of waiting time for motorists over the safety of children and families and residents of all ages walking to Krusi Park and Otis Elementary School and nearby residences and destinations, not to mention also the safety of people in those vehicles.
The chair of the Alameda city Transportation Commission, Scott Wietze, asked Caltrans staff a question at the August 28 meeting regarding Otis Drive:
One of the issues I guess I have with this — and I'm sure you have the data; I just want to know what it is — so there's this statement that we can't do [a] road diet because it will create substantial congestion and delays. Help us understand as a Commission what is that delay. We say "substantial." Substantial [as in] I waited 4 minutes in my car? Or substantial [as in] I waited 50 minutes in my car? Give us boundaries.
To this specific question, he received a general answer from the presenter from Caltrans:
Yeah, I don't know the exact [numbers]. In terms of feet, I know there's a lot of backup on Fernside from High Street. Thousands. Not thousands. It's over a thousand feet. Depends on the direction and the peak period. If it's in the morning or the afternoon. But there is quite a bit of backup along starting at Broadway it's like a thousand feet of backup — 1,200 feet — and then Fernside and Encinal area there's about a thousand feet of backup there too as well. As for High Street, that traffic probably is not going to sit there. They're going to try and find other ways to go.
Chair Wietze responded that:
I think just for the future it's important for the commission to understand not just things like how far back did we sit but how long did we sit. Because [even for the] most pro bike lane amongst us I think we all have a breaking point at which it's like "yeah, listen if you're sitting in your car for an extra 45 minutes I get it and we should talk about it." But if we're constantly talking about backups without context for [whether] your drive was going to be 14 minutes and now your drive is 17 minutes, I don't care. Like that's fine but if your drive was 14 and now it's an hour, I probably care. So I think we all kind of generally lean in the direction of a little inconvenience is fine and a lot of inconvenience is not so fine and that's a measure of inconvenience that's not just distance. It's [about] time out of your life.
To this comment, the Caltrans staffer had no response. But his agency was already equipped with precise time estimates to answer Chair Wietze's exact question.
Now that I've been provided with a copy of the 296 page long "TOAR" document for this Caltrans project, it's straightforward to look up their exact time estimates:
- At the Broadway/Otis Dr traffic light, during the AM peak hour, a driver could wait an average of 110.6 seconds to traverse that intersection after driving through a "road diet", rather than waiting 52.3 seconds under the current road arrangements.
- At the High St/Otis Dr/Bayview traffic light, during the AM peak hour, a driver could wait an average of 50.5 seconds (in the "road diet" arrangement), rather than waiting 17.5 seconds under the current road arrangements.
- (At multiple other intersections, motorists driving through the road diet could actually wait less than they are estimated to do under current road arrangements. More on this later, specifically how the TOAR report supports the road diet as providing meaningful safety improvements for the "double threat" crossing at Mound/Otis.)
Leaving that last point aside, the those first and second numbers are the crux of this matter. Caltrans does not want to potentially cause an approximate 58.3 seconds of delay to motorists at one intersection and an approximate 33 seconds of delay at another intersection at the single busiest morning hour of a typical weekday. Saving those hypothetical seconds for motorists in the aggregate are more important to Caltrans than safety for individual pedestrians and individual cyclists along Otis Drive — not to mention also the safety of individual motorists in their own cars. (The TOAR also speaks to how a road diet would be beneficial to exactly the configuration of auto crash I described in a post on Sept 3, although it's framed as a specific delay that's reduced, rather than a specific safety situation that's improved.)
This blog post is going to travel through some technical terrain of this Traffic Operations Analysis Report ("TOAR"), before coming back to the ultimate questions that confronts Alameda and Caltrans: what are the values that we want expressed on Otis Drive? and are these engineering practices being carried out thoroughly and in support of our shared values?
The TOAR's numerical precision loses sight of all surrounding human context
How did the engineers running this analysis even come up with a number as precise as 110.6 seconds?
When Chair Wietze asked his question, he was asking for an answer in minutes or in hours. The TOAR actually has an answer ready for his question in subseconds!
I got my degree in a different field than the topic of this blog post. Still, I think it's important to bring a common sense understanding to elaborate analytics models that are presented by any professional or academic discipline. When numbers are presented extremely precisely and those numbers are used to make claims about the real world, it's worth asking basic questions.
To calculate these time estimates, consultants to Caltrans used a software package called Synchro. It's a class of analysis called "microsimulation" that's used to simulate individual vehicles traveling along a roadway, waiting at traffic signals, and proceeding along the roadway. Here's a video of someone clicking around Synchro (and using the associated SimTraffic package to visualize the little imaginary vehicles):
Doesn't that kind of look like fun? (For what it's worth, this type of animation is not the output used in this "TOAR" — the engineers output summary statistics in tabular format. All those tables are part of the reason the TOAR is 296 pages with all its appendices.)
Leaving aside the fun of animations: What's concerning is all that's left out of a traffic microsimulation: actual people, their homes/origins, their destinations/workplaces/stores/schools, the reasons they leave their house in the morning! A microsimulation would have nothing to say about why auto traffic happened to decrease in March 2020, or why pedestrian fatalities reached a 40 year high on American roadways in 2022. A microsimulation can't even say why auto traffic suddenly feels more intense in the AM commute period now that Alameda Unified schools are in session again. As a result of focusing on the closed analytical world of this microsimulation, the "TOAR" never touches on many important matters:
- The word "safety" is used zero times in the 296 document, nor are the words "crash" or "accident" or "collision" or "injury" or "fatality" ever used. [I skimmed some "TOAR" documents for other highway projects in the Bay Area. Most others use the word "safety." Some include a section specifically addressing traffic safety.]
- The words "pedestrian" and "bicycle" are used in an appendix with observed counts of vehicles/pedestrians/bicycles at intersections along and near Otis Drive. (Counts of real-world traffic were taken in 2022 to use as inputs to the microsimulation.) However, neither pedestrians nor cyclists are modeled by the microsimulation or referred to in the report body itself. This analysis and its conclusions only concern vehicle throughput and delay.
- The phrase "complete street" is used once as a descriptive term for the potential road diet, but no mention is made of the Caltrans complete streets policy and the specific process requirements instituted in Caltrans Director's Policy 37 in 2021 — despite the fact that this report is listed as being started and completed by Caltrans consultants in 2022.
The focus of this report is extremely narrow:
- the "level of service" at signalized intersections along Otis Drive [as well as a couple intersections on city-owned roads nearby; more on this later]
Level of service
Level of service (or LOS) is how traffic engineers used to characterize delays for motorists at intersections. A letter grade of "A" through "F." If the average delay for a vehicle at an intersection is 110.6 seconds, then that intersection gets an LOS of "F"
But SB 743 specifically concerns environmental review. The TOAR for Otis Drive isn't about a CEQA determination — it's about giving the planners and engineers the confidence to move ahead with a road diet (or in this case, to kill the option of a road diet). So my understanding is that Caltrans District 4 highway maintenance project teams still retain the option hire consultants to perform a traffic signal microsimulation and to calculate the outdated letter grades of LOS, even if in 2022 when preparing this TOAR they could have instead hired consultants to prepare a much more modern and meaningful VMT analysis.
The National Association of City Transportation Officials has a helpful illustration of what a LOS grade "A" looks like and what a LOS grade of "F" looks like:
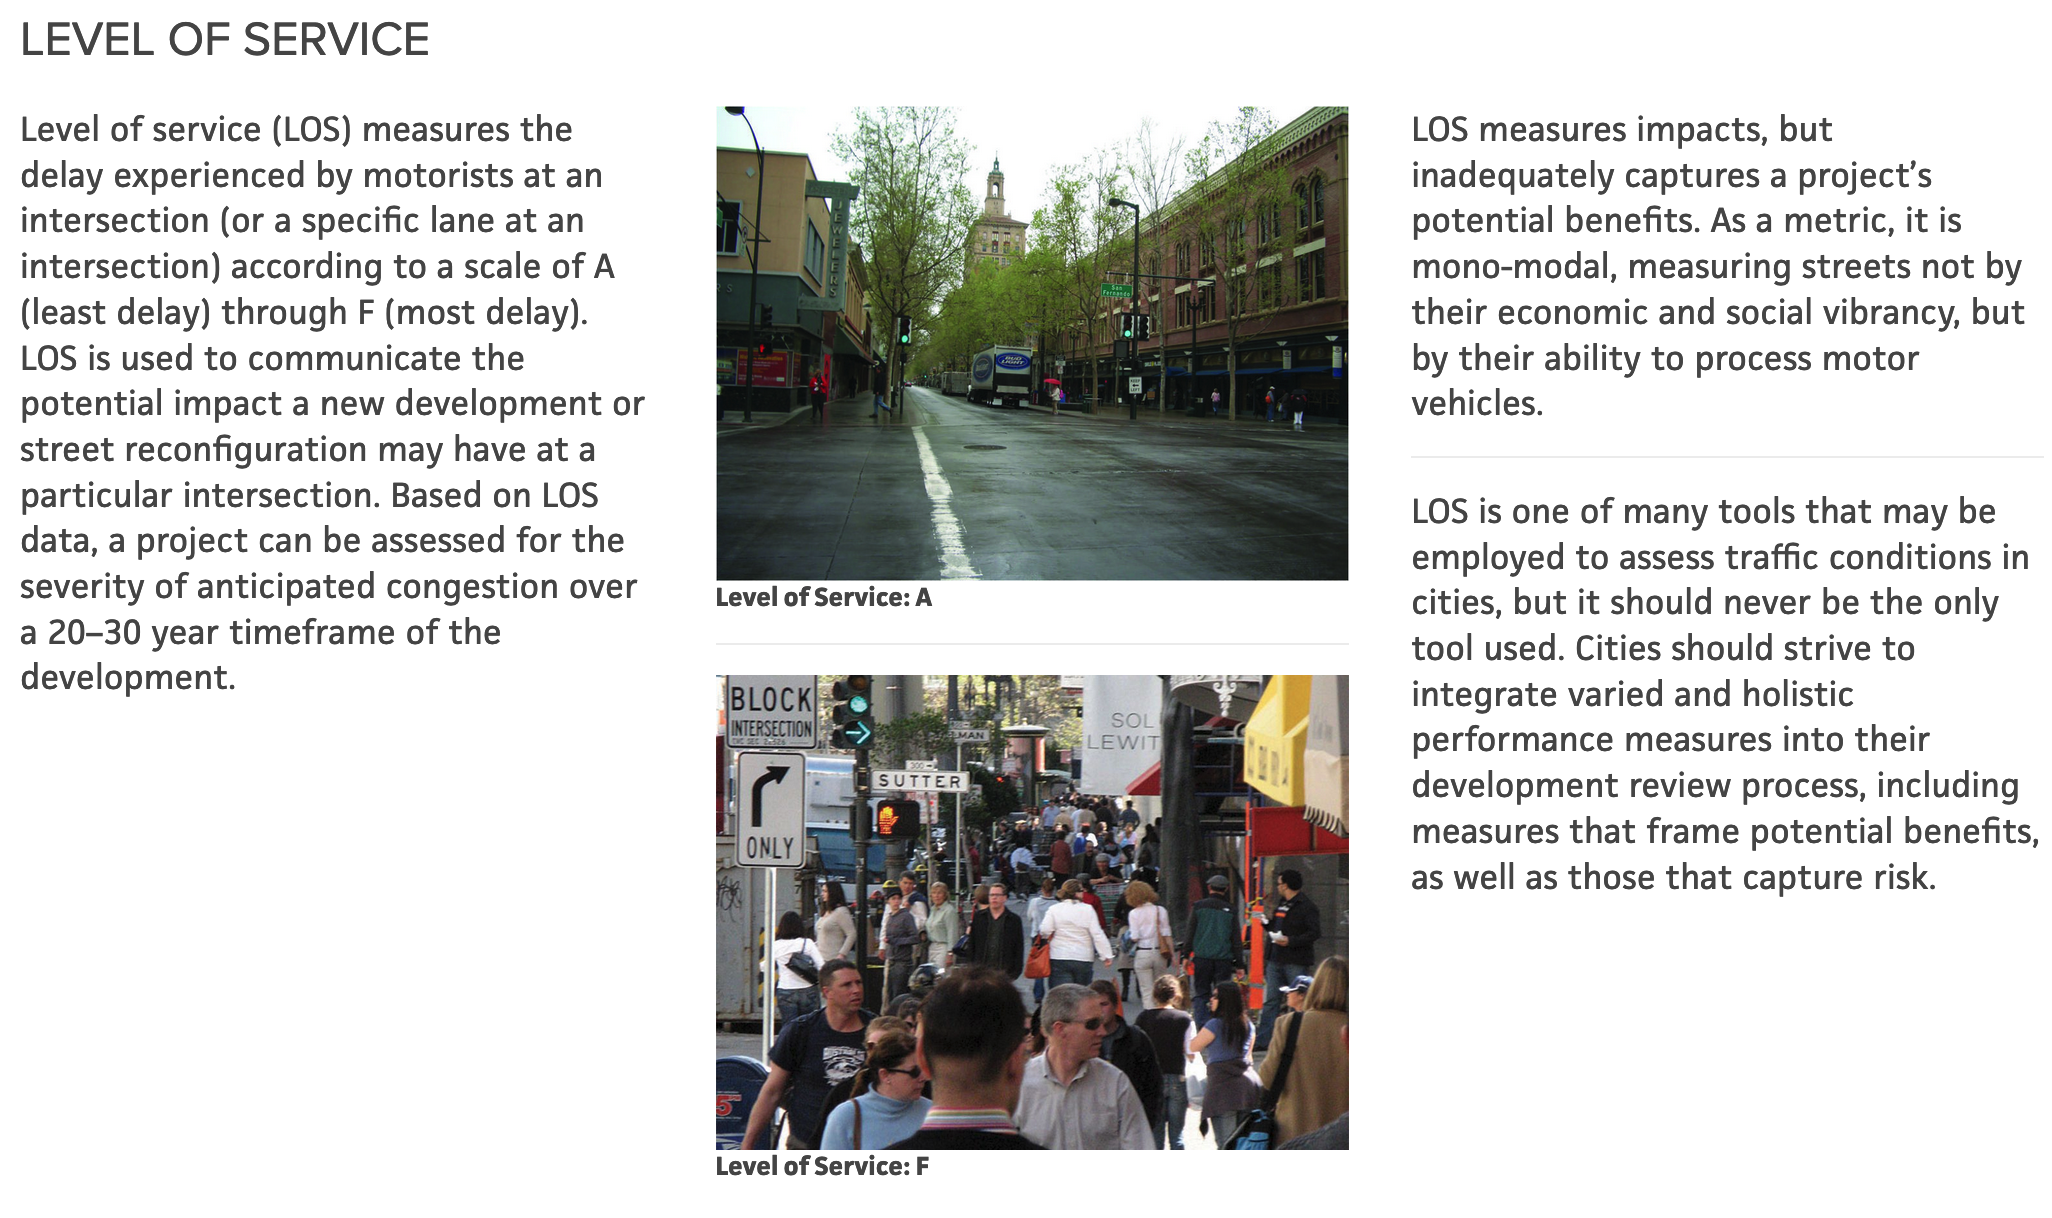
To be clear: I'm not proposing that Otis Drive be turned into a pedestrian-packed Sutter Street in downtown San Francisco (as pictured above). But I do believe I am fairly summarizing the dozens of pages of comments from residents and local stakeholders submitted to Transportation Commission as saying that concepts like the LOS grades for two specific intersections on Otis Drive are not the primary or sole factors that should drive this project.
Even the writers of the TOAR point out limitations of focusing solely on LOS:
The cycle length and signal timing were optimized to improve the intersection efficiency under the [proposed road diet] conditions. It should be noted that this could result in better intersection operation than existing conditions but longer queue lengths, as the optimization process is meant to distribute delay and queues more evenly.
So even if a road diet made drivers wait in a slightly longer line at a few intersections, City of Alameda Public Works staffers tasked with programming those traffic signals could optimize some of the settings and the TOAR writers predict that those drivers would move through those intersections more smoothly than they do currently. The road diet might mean a few seconds delay before approaching an intersection, but less hurried and aggressive driving to clear the intersection. However, this finding doesn't fit into the overly precise estimates of seconds delayed or the letter grades of LOS.
Crossing auto traffic
While the microsimulation didn't model pedestrian behavior at all, it did closely model the intersection at Mound St and Otis Drive and consider how long it would take for a vehicle attempting to drive across Otis Drive at that point. For example, the turn from southbound Mound onto eastbound Otis:
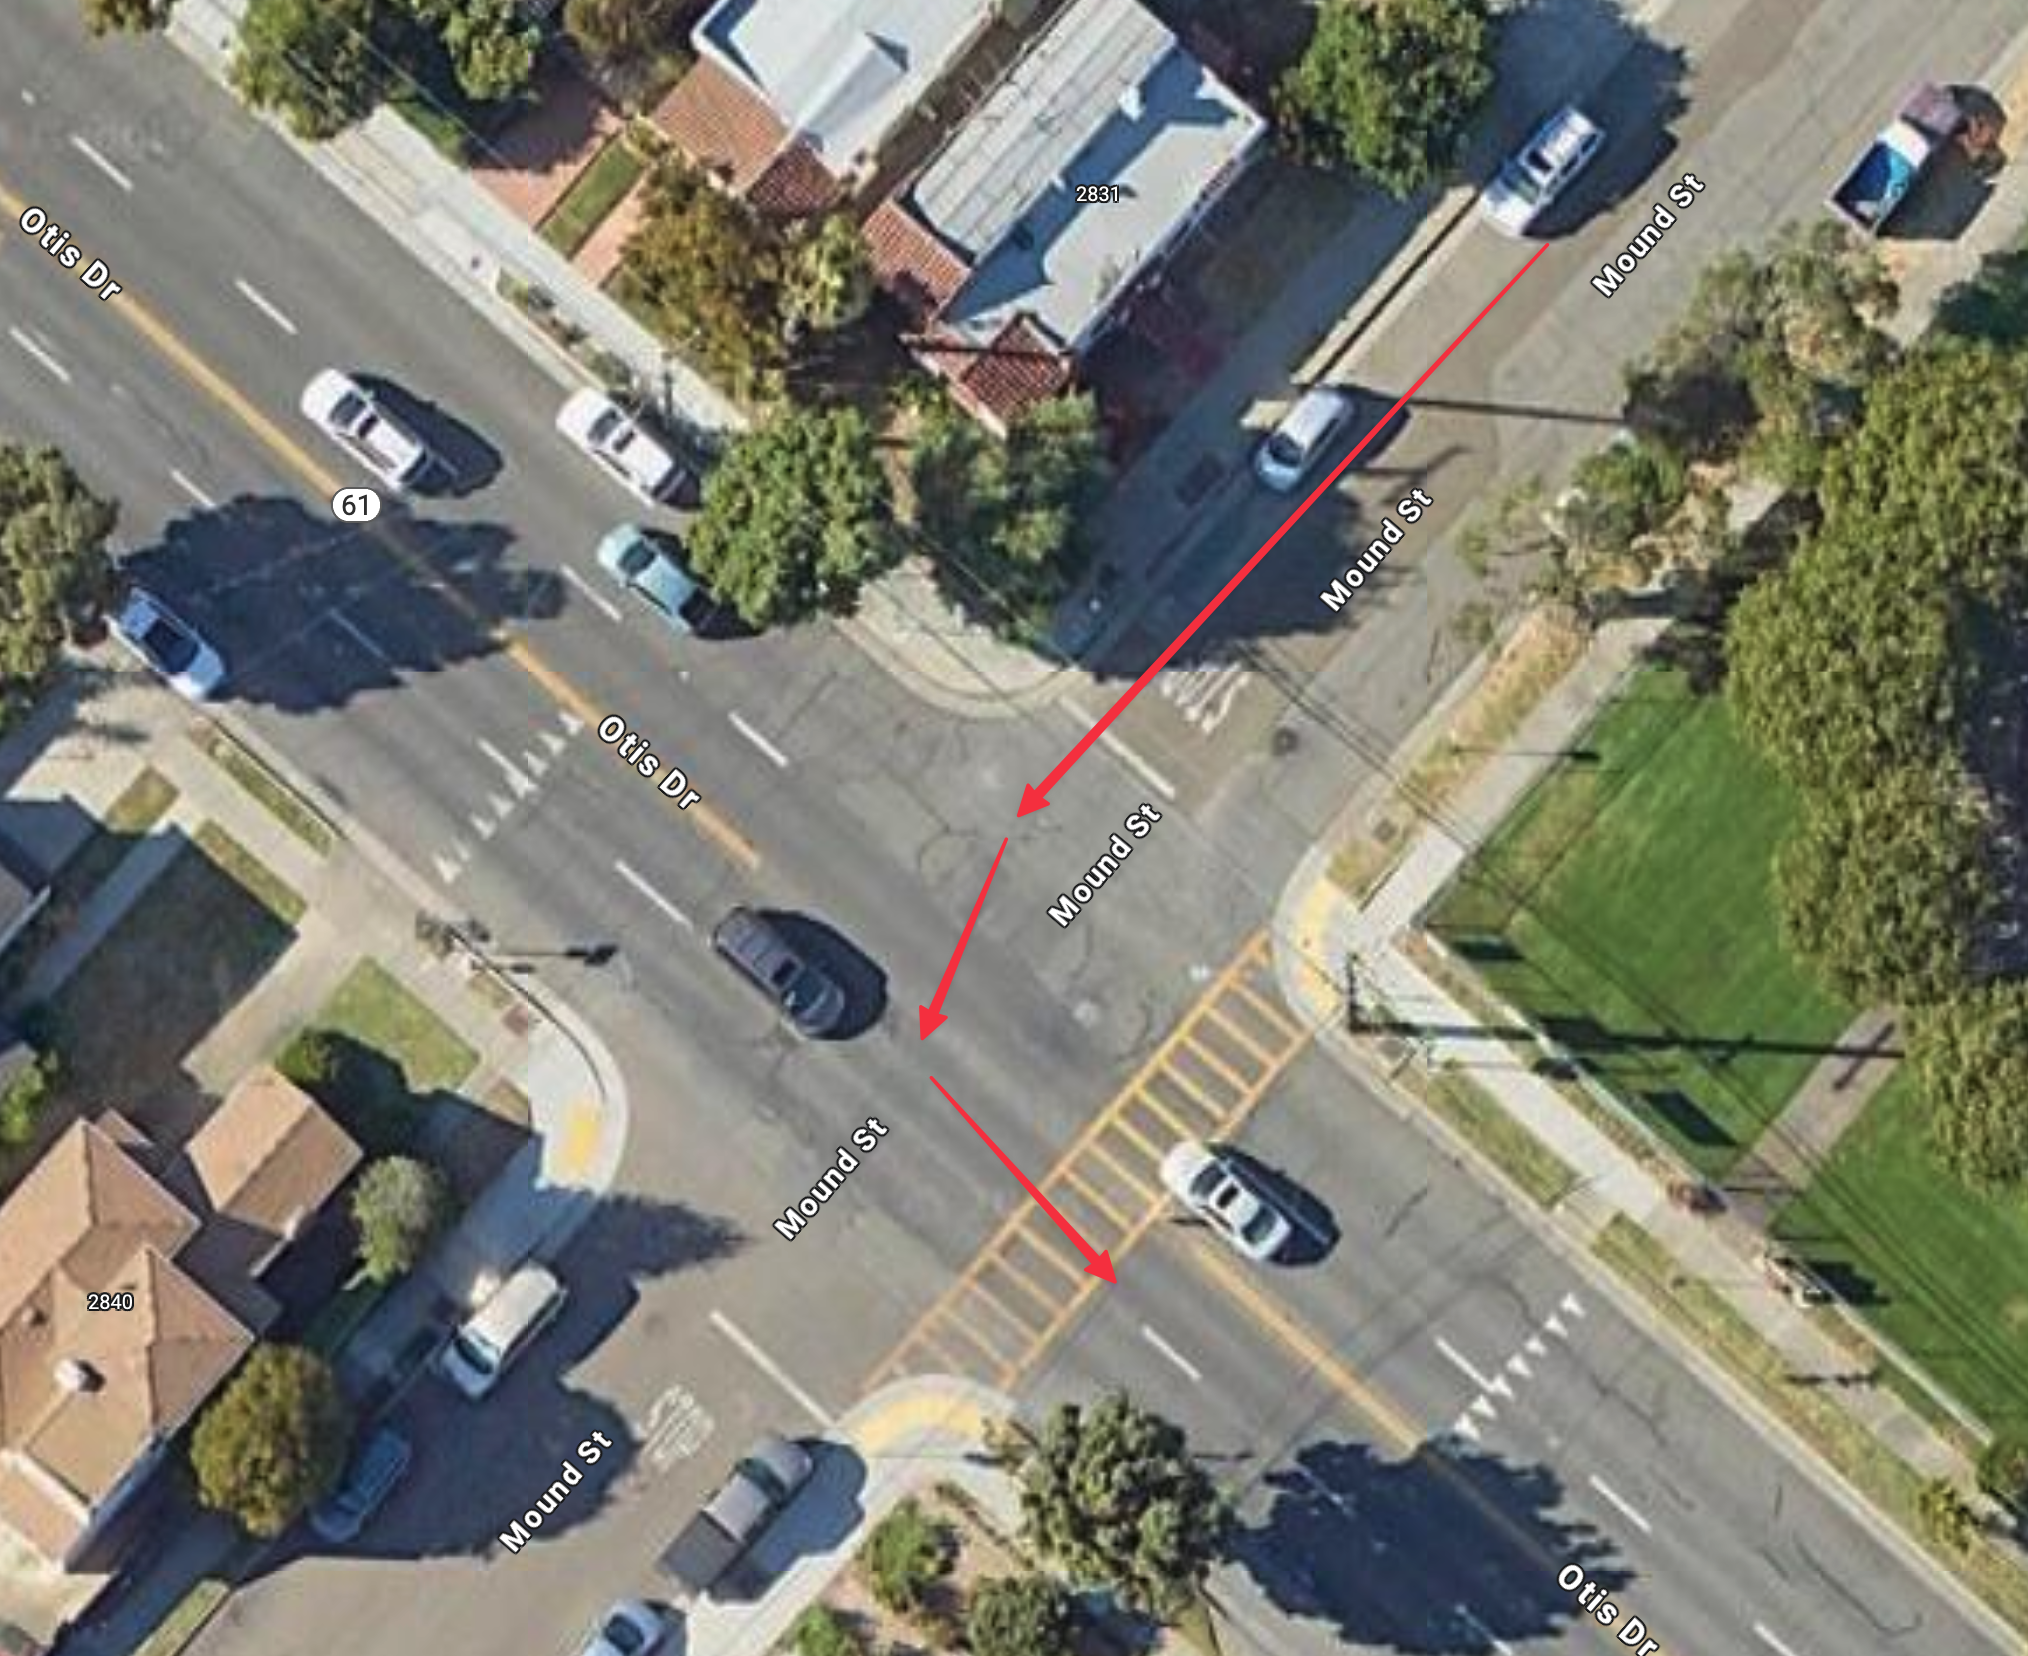
The change is so significant that it's called out on the TOAR's concluding page: "delay at Mound Street & Otis Drive decreas[es] by almost three minutes." [Give them credit for rounding the number this time :]
In other words, thru-traffic on a road diet'ed Otis Drive would move so much more smoothly and slowly than it currently does that someone trying to cross Otis Drive at Mound St, would have to wait ~3 fewer minutes to have a clear crossing.
To model this to a decimal point of precision for pedestrians would, of course, require more parameters, like the walk speed of a pedestrian, and whatever additional assumptions are needed by the microsimulation software. Regardless, this is such a significant decrease in estimated wait time for auto crossing at Mound/Otis that it likely(*) represents a meaningful change that would be felt in real life by pedestrians as well as motorists.
So while the consultants did go to the effort of counting pedestrians at Mound/Otis (in addition to crossing autos and cyclists), they didn't go to the effort to model what ~3 minutes of time saved on average per pedestrian crossing would add up to. More importantly, they don't even have an analytical tool to evaluate how that might improve the overall safety of the street.
What the TOAR is suggesting is that a road diet's removal of the "double threat" facing pedestrians currently crossing at Mound/Otis against 4 lanes of on-coming traffic would be beneficial to pedestrians and to motorists.
"Likely"
While I hedged my claim above about pedestrian crossing times by including the word "likely" at the (*) above (since I'm not an expert in this field), the actual experts writing this TOAR document also liberally used the words "likely" and "could" to qualify their own interpretations of the microsimulation:

While the report often cites the output of the microsimulation with a decimal point of precision, the written analysis sometimes just says there will "likely" be or "could" be even more congestion due to certain conditions. If the microsimulation can't capture these conditions within its analytics lens and field of view, then what's the point of running the microsimulation?!
"Acceptable operation"
Despite all the limitations of the microsimulation, the TOAR authors do use the results to draw the following conclusion about the proposed road diet:
Maintaining the existing approach configuration at the following intersections would potentially achieve acceptable operation along SR 61.
• Broadway & Otis Drive westbound (left, through, and right-turn lanes)
• High Street & Otis Street
• Fernside Boulevard & Otis Drive eastbound (left and two through lanes)
Results for the TWSC intersection show side-street delay at unsignalized intersections would be reduced (at minor approach) in the Build condition compared to No Build, with the delay at Mound Street & Otis Drive decreasing by almost three minutes.
We've already discussed this finding about the Mound/Otis intersection. What's striking about the conclusion above it is that the authors are suggesting that with some specific changes to proposed road diet (the ways it would attach to a few specific "approaches" to specific intersections) then the seconds of added auto delay at those intersections would potentially be negated.
The authors of the TOAR think that Caltrans could realize the improvements at Mound/Otis and minimize any added auto delays at 3 signalized intersections — if they just tried another iteration of the road diet design!
Seen in that light, the purpose of the microsimulation exercise should have been to inform multiple road diet options. Instead of being the end of the story for the road diet, the TOAR should have been a midpoint along an iterative design and evaluation process.
"Build" vs. "Non-Build"
What about a road diet without bike lanes? The Caltrans apparently didn't study that.
What about a road diet with a different length of designated "zipper merge" area where motorists merge from two lanes down to one? Caltrans apparently didn't study that.
What about a road diet on Otis Drive coupled with improvements to neighboring city-owned streets? Caltrans apparently didn't study that. [More on why this is relevant in the next section.]
The TOAR isn't to blame for these decisions. Rather, it's a sign of how narrowly Caltrans considered a single road diet option for Otis Drive — and how the TOAR has been used to justify Caltrans's apparent aversion to any and all road diet concepts for Otis Drive.
Alameda continues to improve its transportation network, but the TOAR isn't even aware of this
The narrow choice of "Build" or "Non-Build" also excludes from the picture the current and future improvements that the City of Alameda is making to adjoining parts of the city's street network.
Besides the queue length at Otis/High and Otis/Broadway intersections at the very peak of commute time, the one other main "LOS" concern of the TOAR is the potential queue length at peak commute time at the intersection of Fernside/Encinal. Should a road diet be instituted on Otis Drive, a portion of westbound drivers are predicted by the TOAR to instead travel up Fernside to Encinal Ave.
Remember that the microsimulation doesn't know or care where people are trying to travel (whether they're going to over South Shore Center or up the downtown parking garage or just for a random cruise to nowhere). The microsimulation is merely pumping a preset number of vehicular "agents" along street segments and through intersections per microsecond — and estimating their delays.
Here's a map from the TOAR to situate yourself. The intersection of Fernside/Encinal is labeled as #10:
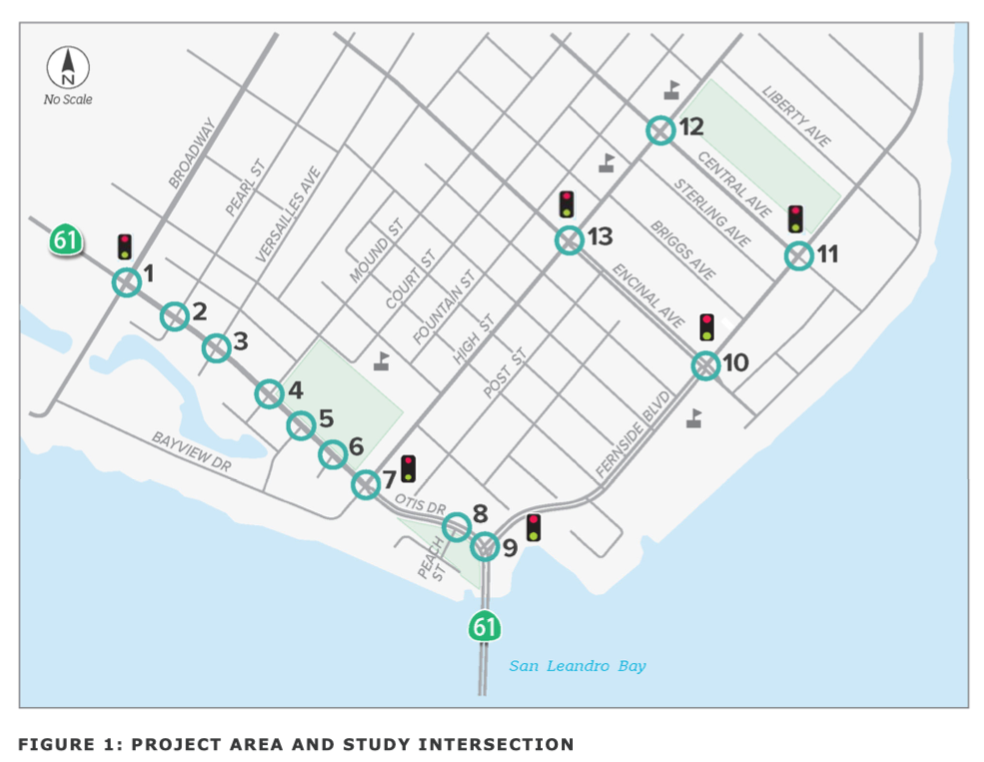
While the TOAR does model vehicles coming and going through the 13 intersections on the above map:
- The TOAR isn't aware of the City of Alameda's Fernside Boulevard Traffic Calming and Bikeways Project currently in planning.
- The TOAR isn't aware that Fernside Boulevard is a segment of the SF Bay Trail and that the City of Alameda can apply to MTC for millions of dollars of "Safe Routes to Transit & Bay Trail Funds" to make improvements to this street.
- The TOAR isn't aware that the intersection of Fernside/Encinal is a major flood hazard with storm drains and piping that will likely need to be rebuilt entirely by the city in coming years.
- The TOAR isn't aware that in 2021 the City of Alameda hired traffic engineers to assess intersections across the city that might be suitable to be transformed into roundabouts — and this analysis identified the intersection of Fernside and Encinal as having strong potential for a "modern roundabout":
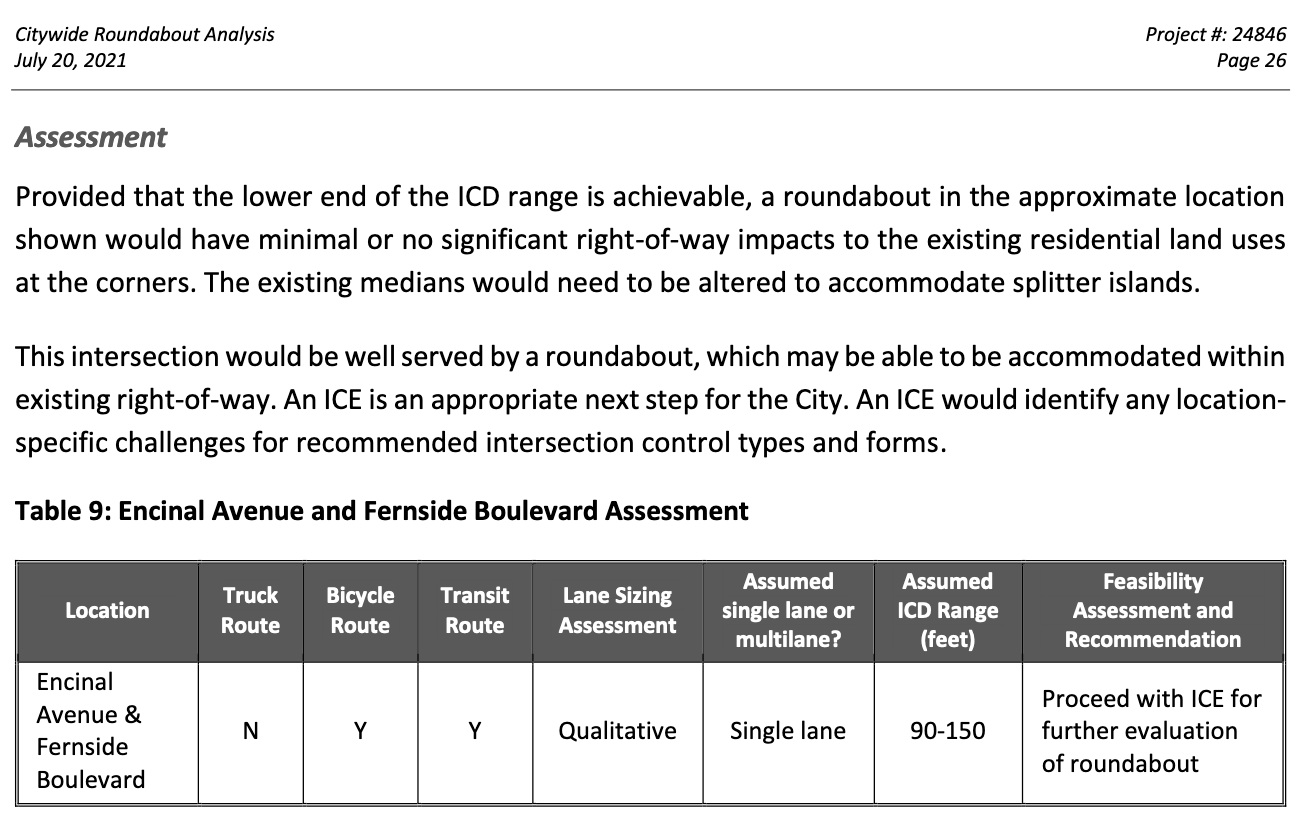
Slightly spreading out the auto traffic that currently concentrates along Otis Drive could actually be a good thing. Improving the intersection at Fernside/Encinal to play a part in distributing a portion of this auto traffic could also be a good thing. Coupling a transportation improvement with flooding mitigations could be a "win win." (If the expert engineers use the word "could" in their own analysis, then I will too :)
In pursuit of justifying the status quo of today's Otis Drive, Caltrans forgot that this is just one piece of a network — a network that is being planned and improved over time horizons stretching out into future years.
2045 may be alright
The most technically sophisticated aspect of the TOAR is a forecast for auto delays on Otis Drive in the year 2045.
Do you know where you plan to be in the year 2045? [Do we even know what's going to come out of this year's US presidential election?] Anyway, Caltrans thinks you'll be in your car in the year 2045 wanting to drive along Otis Drive.
Instead of using actual auto counts from 2022 as inputs to the microsimulation, this forecast uses numbers from a "travel demand model" as inputs to the microsimulation. MTC and the Bay Area counties all maintain their own travel demand models. In this TOAR, the Alameda County Transportation Commission's "four-step" travel demand model was used.
In laypeople's terms, each of these models is a giant Rube Goldberg machine trying to predict where and when people will travel in the year 2040. (Caltrans consultants had to apply some additional transformations to shift the estimates from 2040 to 2045.)
While a travel demand model has no ability to predict traffic in March 2020 (nor does it care about the record high number of pedestrian fatalities across the US), it can turn predictions of employment numbers and predictions of houses built into estimated numbers of auto trips along specific street segments (or "links" in the lingo of travel demand models).
Out the end of this Rube Goldberg machine comes a somewhat startling finding:
However, the westbound volume on SR 61 entering the study area (east of Fernside) is forecasted to decrease, primarily due to land use induced traffic patterns in the region.
When the analytical lens is zoomed out and widened every so slightly — instead of just using the microsimulation, the TOAR is now also referencing a travel demand model — the elasticity of auto travel becomes more apparent. The amount that people drive can change and does change over time!
While it's hard to ascribe particular causes to particular predictions of transportation demand models, I would guess that this specific decrease in auto traffic is due to the projected increase in housing units on Alameda Island. (Note that some other directions of travel are forecasted to have increased auto traffic in 2045.)
More housing closer to jobs and closer to retail means less slightly need to drive. While each individual and family still makes their own decisions about when to hop in a car, the travel demand model is forecasting changes in the overall aggregate. That forecased change should remind us all — and remind Caltrans too — that many factors affect Otis Drive. It's not just the exact count of auto lanes or the exact timing of traffic signals that matters. It's also where we live and how we live our lives.
All that said, the premise of using a travel demand model to run a traffic microsimulation for the year 2045 looks like a strange exercise. It raises questions that simply can't be answered about the future. How can its subsecond results stand up to scrutiny? [Plus aren't we supposed to be flying in autonomous electric helicopters?!] In contrast, the microsimulation based inputs of actual 2022 traffic counts did provide concrete suggestions to the Caltrans team for how to potentially further improve the design of the road diet — even if they apparently didn't act on those suggestions.
Is this a situation of lazy engineering practices or a choice made based on lousy values?
This blog post is so long because it's speaking to two different qualities:
- the "hard" world of engineering practices
- the "soft" world of our shared values
In terms of engineering practices, the Caltrans SR-61 road diet study for Otis Drive sure looks like an incomplete exercise. The TOAR conclusions page (p. 31) provides specific suggestions to inform one or more additional "road diet" designs. These suggestions do not appear to have been received, acted upon, or tested by the project team.
While Caltrans has shared a copy of the TOAR, I haven't yet seen the project initiation document. (Probably it's just such a giant PDF that it's getting stuck in email transmission.) Perhaps the PID will shed some light on how Caltrans D4 is sidestepping the complete streets policies.
In terms of shared values, Chair Wietze suggested with his questioning that we bring a sense of proportion to the decision of whether to implement a road diet. Since he was only provided with estimates in feet-length of cars waiting at intersections, he didn't get to hear that the TOAR estimates that a road diet would add seconds or tens of seconds of delays under specific conditions and at specific times (not multiple minutes, let alone hours).
Are those specific delays of seconds to motorists in the aggregate a reasonable trade for improved safety for everyone along Otis Drive? That's a decision that's ideally informed by both solid engineering practices and by our shared values.
Almost all of the people who wrote and called into the TC meeting on August 28 spoke to values that prioritize safety. And for the subset who disagreed or spoke to the value of "flow" for autos, I think those folks might be genuinely curious to hear how specifically small the estimated delays are in this TOAR document. They may also be intruiged to hear about the trade presented by the road diet: a few more seconds waiting to reach a traffic light in exchange for a calmer drive through that intersection — not to also mention fewer crashes blocking the roadway.
Let me conclude with one of our shared values in Alameda: having a meaningful opportunity for public input and involvement. While this blog does quibble with some city projects sometimes suffering from too much and/or too frequent public input, I do also strongly believe that all community members should have structured opportunities and venues to provide input to the planners and engineers and consultants who carry out this work on our collective behalf. That's why I volunteer my time on the city's Transporation Commission. That's why I try to read all the written public comments and listen to all the live public comments. Whether or not I agree with everyone's specific comments/requests/questions/priorities/etc, I definitely agree that public engagement is a key ingredient in all transportation projects in Alameda. Every voice is important.
The TC received dozens of pages of emails about this project. But neither the TC nor the City of Alameda has the power to make decisions about this project on Otis Drive. While I'm continuing to receive additional emails and Facebook messages from residents who didn't know about this project on August 28 asking where they can now email their own comments, I don't have a useful response to share with them.
Based on a read of this TOAR document, this Caltrans project for Otis Drive sure looks like it's flunking the test for solid engineering practices and not even attempting to engage with Alameda's shared values.